Customizing Chart Style
Switching in Between Themes
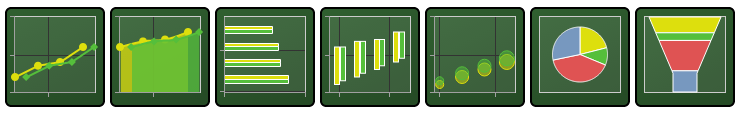
ZK Charts provides many predefined color themes for you to use.
Here’s a list of the themes in which you can choose from:
- Default Theme
chart.setTheme(Theme.DEFAULT);
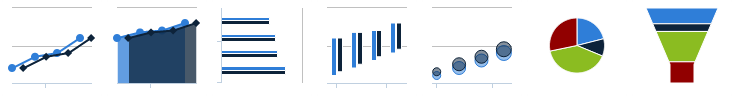
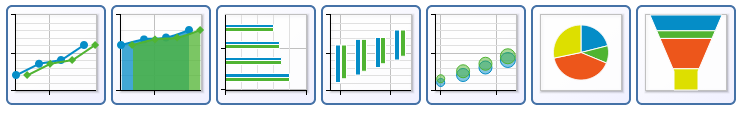
- Grid Theme
chart.setTheme(Theme.GRID);
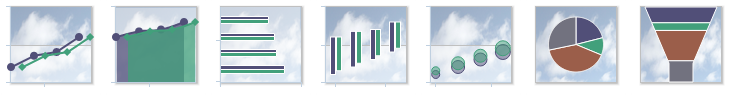
- Skies Theme
chart.setTheme(Theme.SKIES);
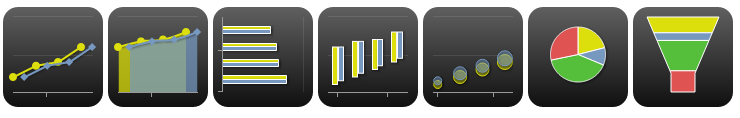
- Gray Theme
chart.setTheme(Theme.GRAY);
- Dark Blue Theme
chart.setTheme(Theme.DARK_BLUE);
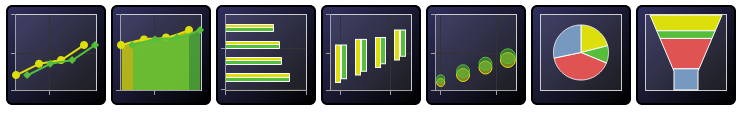
- Dark Green Theme
chart.setTheme(Theme.DARK_GREEN);
See all themes at Theme
Change Color
Change Default Color
The component defines 10 default colors, you can provide a different set of colors:
    String[] colors = {
            "red",
            "blue",
            "green",
            "yellow",
            "purple",
            "orange",
            "pink",
            "brown",
            "gray",
            "teal",
            "black"
    };
    @Override
    public void doAfterCompose(Component comp) throws Exception {
...
        charts.setColors(colors); //provide a list of default colors
    }
Change a Series Color
charts.getSeries().setColor("#aabbcc"); //change a specific series
Customizing Colors
ZK Charts uses
org.zkoss.chart.Color class to
apply the color to the color-changing method in the option, such as
setBackgroundColor() or setFillColor(). Color supports solid color
and gradient color.
ZK Charts use the Color class to represent web color including solid
or gradient. It can be applied to the configuration so that we can
obtain a customized style.
Solid Color
Solid color can be specified as an RGB triplet, in hexadecimal format or any valid color format in browsers:
- RGB triplet -
new Color("rgb(186,86,150)") - Hexadecimal format -
new Color("#58BA7A")
Gradient Color
A gradient is a smooth color transition from one color to another. In ZK Charts, a gradient is defined by org.zkoss.chart.LinearGradient or org.zkoss.chart.RadialGradient, they have similar attributes to SVG Gradients.
Linear Gradient
Linear gradient contains attributes x1, y2, x2 and y2 to define
the start and end position of the gradient. It can be assigned like
below:
    // Create a linear gradient which x1=0, y1=0, x2 = 0, y2=1 with percentages represent values
    LinearGradient linearGradient1 = new LinearGradient(0, 0, 0, 1);

    // Create a linear gradient which x1=0, y1=0, x2 = 0, y2=300 with coordinate
    LinearGradient linearGradient2 = new LinearGradient(0, 0, 0, 300);
The stop attributes can be assigned as below:
   // Same as linearGradient.addStop(0, "#EEEEEE"); linearGradient.addStop(1, "#CCCCCC");
    linearGradient.setStops("#EEEEEE", "#CCCCCC");
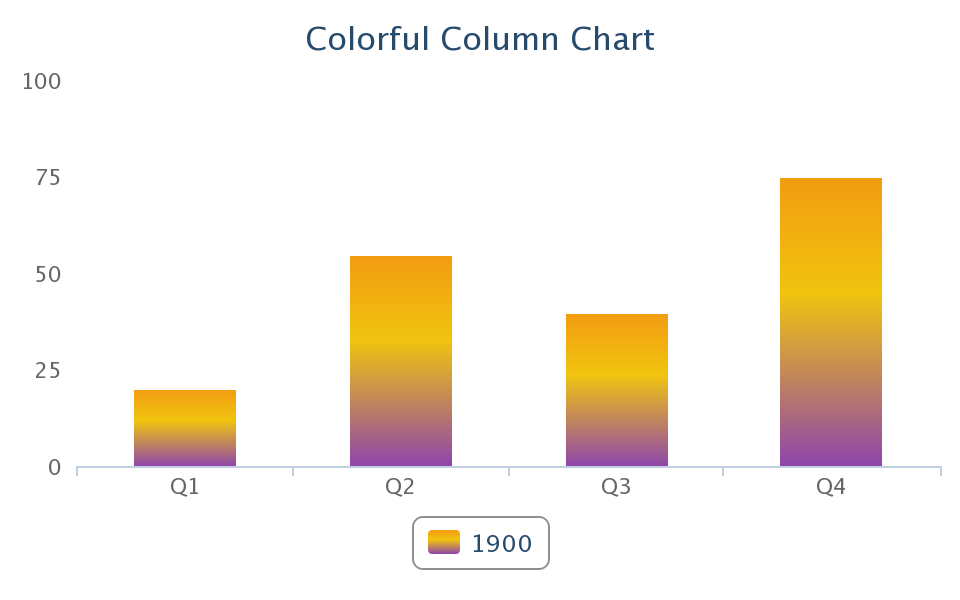
For example, we can apply the linear gradient color to the series as below:
<div apply="ColorfulColumnChartComposer">
    <charts id="chart" type="column" width="480"
        height="300" title="Colorful Column Chart"/>
</div>
public class ColorfulColumnChartComposer extends SelectorComposer<Div> {
    @Wire
    Charts chart;

    public void doAfterCompose(Div comp) throws Exception {
        super.doAfterCompose(comp);

        CategoryModel model = new DefaultCategoryModel();
        model.setValue("1900", "Q1", 20);
        model.setValue("1900", "Q2", 55);
        model.setValue("1900", "Q3", 40);
        model.setValue("1900", "Q4", 75);

        chart.setModel(model);

        // remove grid line
        chart.getYAxis().setGridLineWidth(0);
        // remove y axis title
        chart.getYAxis().setTitle("");

        useGradientColor();
    }

    private void useGradientColor() {
                // Create a linear gradient which x1=0.5, y1=0, x2 = 0.5, y2=1 with percentages represent values
        LinearGradient gradient = new LinearGradient(0.5, 0, 0.5, 1);
        gradient.addStop(0, "#F39C12");
        gradient.addStop(0.4, "#F1C40F");
        gradient.addStop(1, "#8E44AD");
        chart.getSeries().setColor(new Color(gradient));
    }
}
Radial Gradient
Radial gradient is similar to linear gradient, but it specifies the attributes to define the outermost circle instead of line position:
  // cx=0.4, cy=0.3, cr=0.6
  RadialGradient radialGradient = new RadialGradient(0.4, 0.3, 0.6);
  radialGradient.setStops("#EEEEEE", "#CCCCCC");
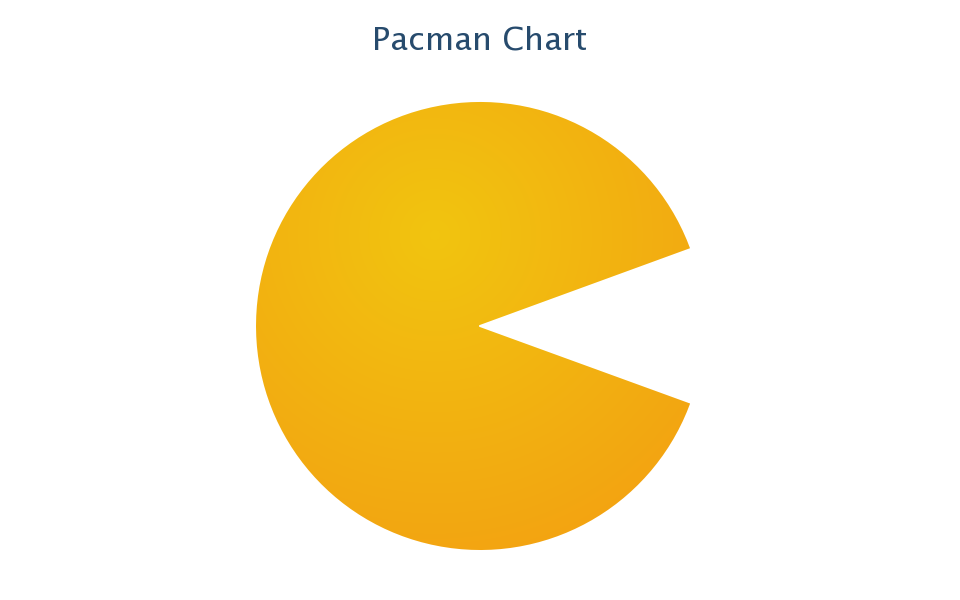
For example, here is pacman chart with radial gradient fill:
<div apply="demo.PacmanChartComposer">
    <charts id="chart" type="pie" width="480"
        height="300" title="Pacman Chart"/>
</div>
public class PacmanChartComposer extends SelectorComposer<Div> {
    @Wire
    Charts chart;

    public void doAfterCompose(Div comp) throws Exception {
        super.doAfterCompose(comp);

        PiePlotOptions plotOptions = chart.getPlotOptions().getPie();
        plotOptions.setStartAngle(70);
        plotOptions.getDataLabels().setEnabled(false);

        Series series = chart.getSeries();
        Point ghost = new Point("Ghost", 40);
        ghost.setColor("#FFFFFF");
        series.addPoint(ghost);
        Point pacman = new Point("Pacman", 320);
        pacman.setColor(getPacmanColor());
        series.addPoint(pacman);
    }

    private Color getPacmanColor() {
        // cx=0.4, cy=0.3, cr=0.9
        RadialGradient radialGradient = new RadialGradient(0.4, 0.3, 0.9);
        radialGradient.addStop(0, "#F1C40F");
        radialGradient.addStop(1, "#F39C12");
        return new Color(radialGradient);
    }
}
Customize Axis Label with HTML
Sometimes you want special axis label e.g. a hyperlink on an axis label,
you can enable this feature by
chart.getXAxis().getLabels().setUseHTML(true). Please refer to the
example code below for details:
public class HtmlLabelComposer extends SelectorComposer<Component> {

    @Wire
    Charts chart;

    private static CategoryModel model;

    public void doAfterCompose(Component comp) throws Exception {
        super.doAfterCompose(comp);

        model = new DefaultCategoryModel();
        model.setValue("John", "<a title='great!!' href='https://www.zkoss.org' class='hastip'>Apples</a>", 5);
        model.setValue("John", "<a title='great!!' href='https://www.zkoss.org' class='hastip'>Pears</a>", 9);
        model.setValue("John", "<a title='great!!' href='https://www.zkoss.org' class='hastip'>Oranges</a>", 4);
        chart.setModel(model);

        // enable html usage
        chart.getXAxis().getLabels().setUseHTML(true);
    }
}
Then, the axis label will become a hyperlink. (see the image below)

Change Decimal Point or Thousands Separator
public class DrilldownOnDemandComposer implements Composer<Charts> {
...
        Lang lang = new Lang();
        lang.setDecimalPoint(",");
        lang.setThousandsSep(".");
        Options options = new Options();
        options.setLang(lang);
        chart.setOptions(options);
- Reference Highcharts Configuration
Data Label
Show x / y values in a custom format, e.g. 2000 -> 2K.
    private void setDatalabelFormatter() {
        JavaScriptValue js = new JavaScriptValue("function(){if ( this.y > 1000 ) return Highcharts.numberFormat( this.y/1000, 1) + \"K\"; \n" +
                "else \n" +
                "          return this.y;}");
        chart.getSeries().getDataLabels().setEnabled(true);
        chart.getSeries().getDataLabels().setFormatter(js);
    }