Create your first ZK Charts
In this section, we will show how to create your first ZK Charts component step by step.
A Very Basic Chart
First, declare a chart component in a ZUML document. Specify type and
title properties.
chart.zul
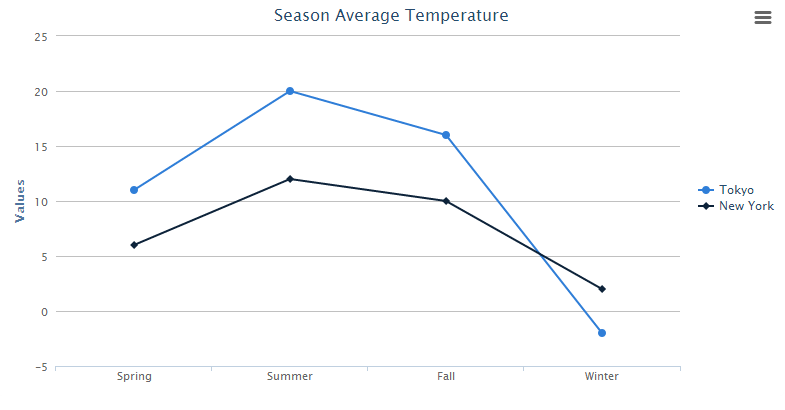
<charts id="chart" type="line" title="Season Average Temperature"
    apply="org.zkoss.zkcharts.essentials.FirstChartComposer"/>
Use model to handle chart data, and set model to chart in a Controller which extends org.zkoss.zk.ui.select.SelectorComposer
First ChartComposer.java
public class FirstChartComposer extends SelectorComposer<Component> {
    @Wire
    Charts chart;

    public void doAfterCompose(Component comp) throws Exception {
        super.doAfterCompose(comp);
        // Create a predefined implementation category model
        CategoryModel model = new DefaultCategoryModel();

        // Set value to the model
        model.setValue("Tokyo", "Spring", new Integer(11));
        model.setValue("Tokyo", "Summer", new Integer(20));
        model.setValue("Tokyo", "Fall", new Integer(16));
        model.setValue("Tokyo", "Winter", new Integer(-2));
        model.setValue("New York", "Spring", new Integer(6));
        model.setValue("New York", "Summer", new Integer(12));
        model.setValue("New York", "Fall", new Integer(10));
        model.setValue("New York", "Winter", new Integer(2));

        // Set model to the chart
        chart.setModel(model);
    }
}
After that, you can easily obtain an amazing chart to visualize your data.

Change Configuration
Moreover, if you want to change the configuration, you can add additional declarations in the composer:
    // Get the legend option in chart
    Legend legend = chart.getLegend();

    // Chage lengend's layout to vertical
    legend.setLayout("vertical");

    // Change lengend's alignment
    legend.setAlign("right");
    legend.setVerticalAlign("middle");

    // Remove lenged's border
    legend.setBorderWidth(0);
The org.zkoss.chart.Legend of chart will be moved to the right of the chart without border.